Digital Enterprise Graph Side Panel
| Digital Enterprise Graph subscription required. |
The Digital Enterprise Graph side panel is accessible using the  icon in the top right of the interface and also from the View ribbon under the Right Panels section.
The panel visualizes the content of the Digital Enterprise Graph and allows to drag-and-drop elements to the modeling canvas to reference them in the current model.
Note: Only the items with a colored line on top can be added to the project.
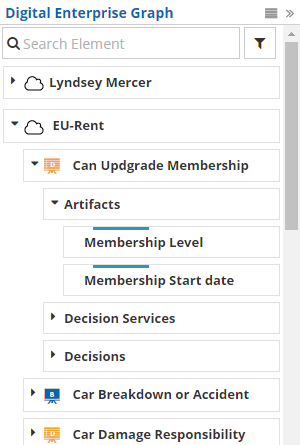
The presentation of the graph elements is hierarchical and alphabetically sorted.
In the panel, clicking on an item currently reused in the project will show one of its usages. If the item is reused mutiple times, only one usage is shown, prioritising the current page.
Searching
To search the graph, type your query in the search bar at the top of the interface.
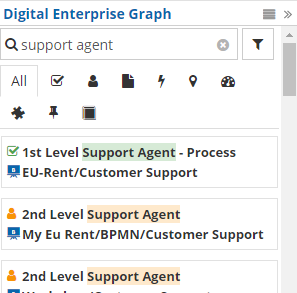
The result can be further filtered down by type of graph element using the filtering icons available at the top.