Making the Diagram Neat
Arranging and Aligning Shapes
DRDs are more easily understood when the drawings are kept neat with proper spacing, alignment, and minimal crossing links.
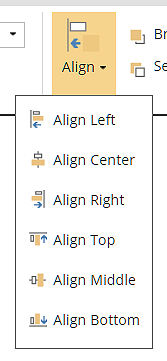
Align
With multiple diagram nodes selected, the Align action on the Home ribbon moves them into the selected alignment.
Gridlines |
Control the presence of grid lines in the background of the diagram. |
Snap to grid |
Control if the mouse snaps to the grid lines when moving and creating shapes. |
Snap to guidelines |
Control if the mouse snaps to guide lines when moving a shape. Guide lines snaps to the neighboring nodes center to facilitate the alignment with other nodes when moving. |


Adjusting Link Position
Selecting a link creates a grab point at each end and a bend point in the middle. To move an end point simply drag the grab point and drop at a new location. It should snap to a connection point on a diagram node. If not properly attached to connection points at both ends, the link will be displayed in red and the diagram will be invalid.
To correct links pointing in the wrong direction, right-click the link and select Reverse link direction.
You can change the path of a link by dragging a bend point. The end points and other bend points remain in place.
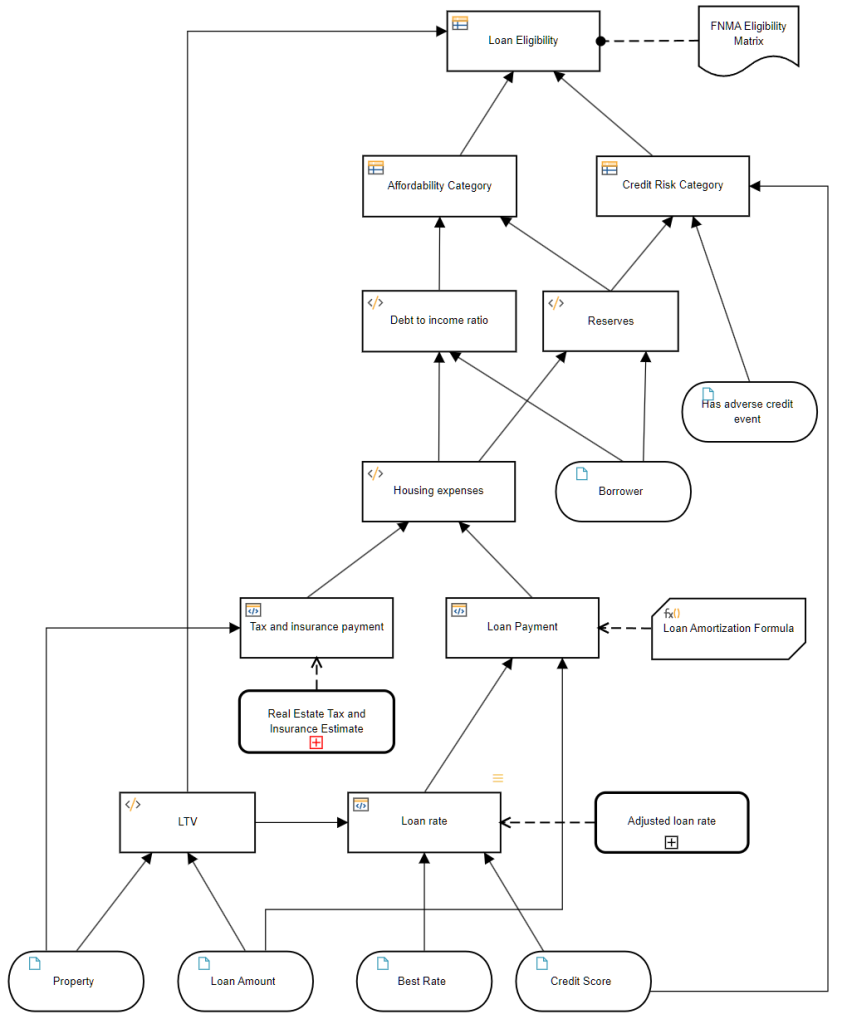
For example, the diagram below could be made more compact and neater:
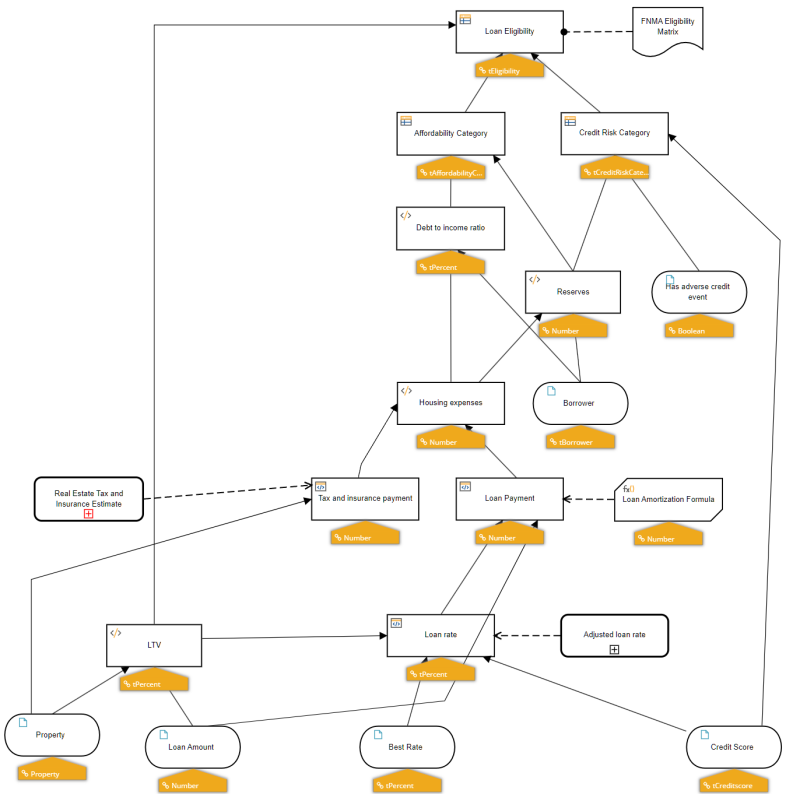
Aligning shapes and adjusting links provides a DRD that is easier to read. Here the datatype overlay has been removed. Note it is not always possible to completely eliminate crossing links.
If a link has too many bend points, right-click and select Reset link to create a straight line link between the end points. Then you can create new bendpoints.
Hide
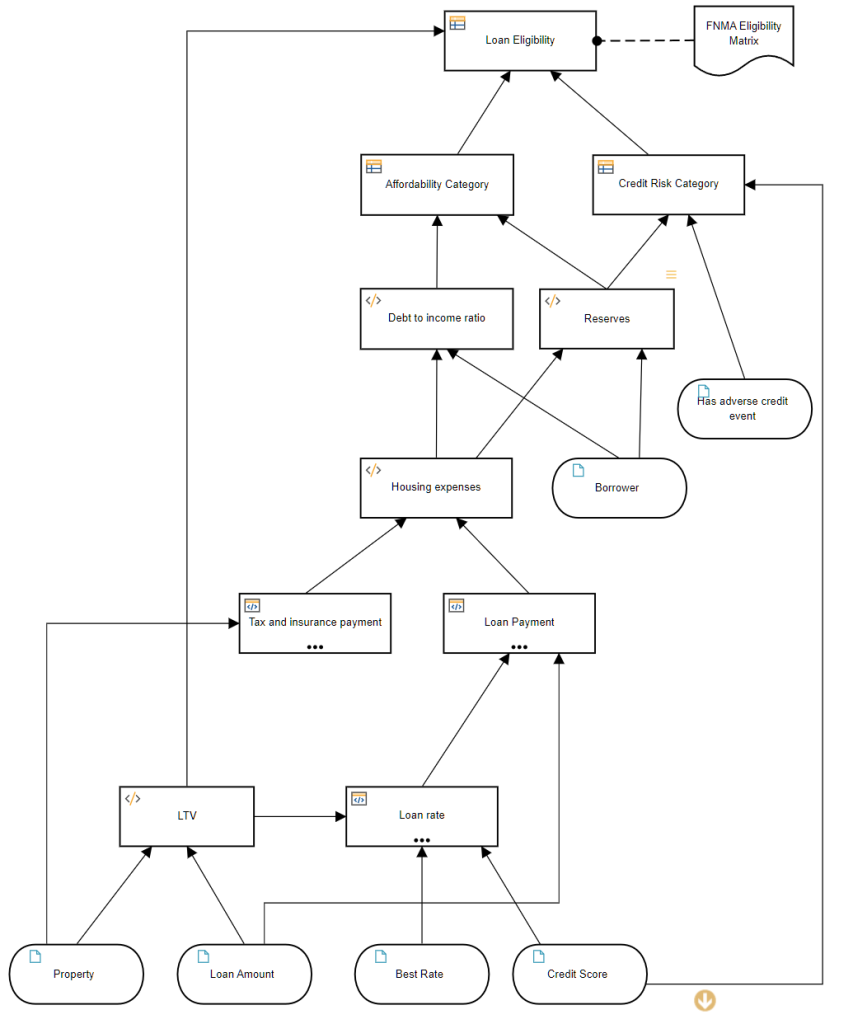
The DRD is technically a filtered view of the entire Digital Requirements Graph. It may hide certain elements in order to make the overall meaning clearer. Right-clicking a node and selecting Hide will hide the node and add a three-dot ellipsis to the bottom of the node it connects to via information requirement or knowledge requirement. This is used most often with BKMs and decision services. The diagram below hides the BKM Loan Amortization Formula and the decision services Real Estate Tax and Insurance Estimate and Adjusted loan rate:
To unhide a shape, click on the three dots and select the shape to unhide.