View

The View ribbon provides the following actions:
-
Diagram/Relation view
-
Zoom In/Out/Standard/Fit to model
-
Grid Gridlines/Snap to grid/Snap to guidelines
-
Model Language Translate
-
Right Panels
Diagram or Relation View
The Diagram view displays the process diagram in the main panel. The Relation view instead displays the matrix of element relationships, such as RACI, as discussed here.
Grid Actions
These actions control placement of shapes in the diagram, as described here.
Model Language Actions
These actions contol the language used in the model, as described here.
Right Panels
Actions in this section enable display of the selected panel on the right side of the screen:
-
Scope, as described here.
-
Digital Enterprise Graph, as described here.
-
Accelerators, as described here.
-
Dependencies, displaying models in the Digital Enterprise Graph where current model elements are used, as discussed here.
-
Comments, as described here.
-
Issues, as described here.
-
Overlays
-
The Overlays panel allows the presence of various model properties to be displayed via a graphic overlaid on the related diagram shape. Multiple overlays may be selected.
-

-
Test Cases
-
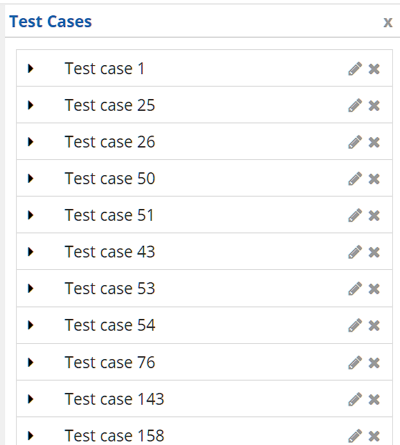
The Test Cases panel displays the list of test cases saved from the Test action on the Execution ribbon. A test case includes the decision service input and output values. Clicking the Play icon on the right runs the test case, and an icon indicates whether the output agrees with the saved test case. Expanding the triangle icon on the left displays the details of the input and output data.
-

-
Heatmaps
-
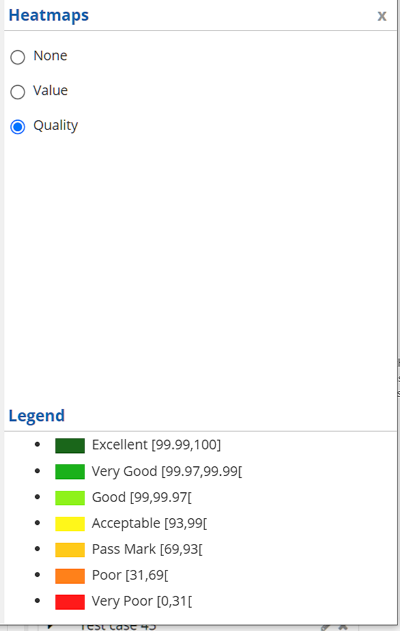
Heatmaps allow diagram elements to be color-coded to display properties defined in the heatmaps panel.
-

-
Connectors Library
-
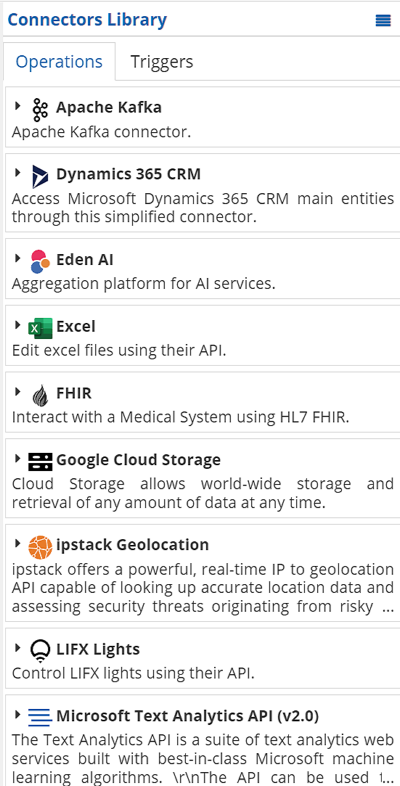
the Connectors Library panel exposes connectors to third-party REST services and triggers that can be dragged onto the diagram as prebuilt service tasks.
-
