Diagram and Shape Properties
Controlling Diagram Zoom
At the bottom right of a diagram, the zoom controls are available
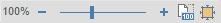
It indicates the zoom factor, there is a zoom scale that can be interacted with the mouse or using the plus and minus buttons. Finally, two buttons offer to zoom to 100% ( ) or zoom to fit the model (
 ).
).
The zoom functionalities are also exposed under the View ribbon.
Controlling Canvas Size
To resize the diagram canvas size, mouse over at one of the edges of the canvas and two arrows will appear ( / ). Clicking on the arrow buttons will expand or collapse the diagram canvas drawable area.
Heatmaps
The diagram canvas allows you to color shapes based on heatmap criteria. Heatmaps are controlled from the heatmaps (  ) right side panel.
Shape Style
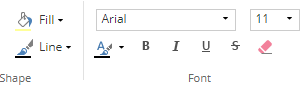
In the diagram view, various aspects of the nodes and links styles can be customized from the Home ribbon.
|
Change the shape line color. |
|
Change the shape fill color. |
Font family |
Change the shape label font family. |
Font size |
Change the shape label font size. |
|
Change the shape label font color. |
|
Toggle the shape label bold font style. |
|
Toggle the shape label italic font style. |
|
Toggle the shape label underline font style. |
|
Toggle the shape label strilethrough font style. |
|
Restore the shape style to its default values. |


